
This guide explains how to read a real estate market report, specifically in the context of Florida housing data, so buyers and sellers can understand what the numbers actually mean.
Real estate market reports are everywhere. Brokerage websites, MLS dashboards, Realtor blogs, news articles, even social media posts are filled with charts and statistics claiming to explain what the market is doing.
The problem is not the data.
The problem is interpretation.
Most people glance at one or two numbers, usually price, and draw sweeping conclusions that are not supported by the full report. Others skim through charts without understanding what they are actually measuring or how the pieces fit together.
This guide is designed to fix that.
In this article, we will walk through how to read a real estate market report the way a professional does. Step by step. Section by section. Data point by data point.
By the end, you will understand how to extract real insight from a market report, whether you are a buyer, seller, investor, or simply trying to make sense of the headlines.
What is a real estate market report?
A real estate market report is a historical snapshot of activity for a specific area over a specific period of time.
You can view current Florida real estate market reports by city here: https://easy.realty/real-estate-market-reports/
Most Florida market reports are generated monthly and pull data from the local MLS. That data typically includes closed transactions, active listings, pending sales, and pricing information.
It is important to understand what market reports are and what they are not.
They are descriptive, not predictive.
They explain what has happened, not what will happen.
They show patterns and trends, not guarantees.
Used correctly, a market report helps you understand market direction, balance, and momentum. Used incorrectly, it leads to overconfidence or unnecessary panic.
How to Read a Real Estate Market Report Using Real Florida Data
Start at the Top: Understanding the Market Snapshot
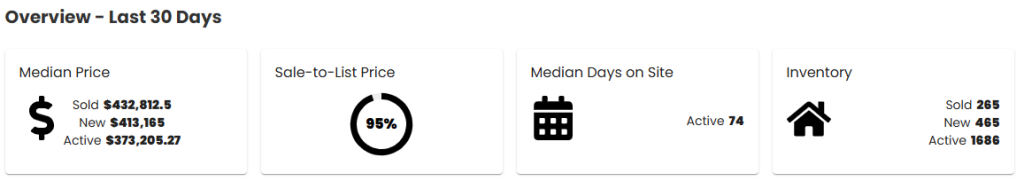
At the top of most Florida real estate market report pages, you will see a group of headline numbers. These often include metrics such as:
Median sale price
Average days on market
Total active listings
New listings
Homes sold
This section exists to provide orientation, not conclusions.
Think of it as the dashboard of a car. It tells you speed, fuel level, and engine status, but it does not tell you where the road is heading or what conditions lie ahead.
Each of these metrics has value, but none should be interpreted in isolation.
Median Sale Price: Important but Often Overemphasized
The median sale price is the midpoint price of all homes sold during the reporting period. Half sold for more, half sold for less.
This metric is widely used because it is less affected by extreme high or low sales than the average price.
However, median price is a lagging indicator.
It reflects decisions buyers made weeks or months earlier. By the time a sale closes, market conditions may already have shifted.
Median price can also move for reasons unrelated to market strength, such as changes in the mix of homes being sold. A surge in luxury sales can push the median up even if demand overall is softening.
Professionals look at price trends, not single price points.
Average Days on Market: Reading Buyer Urgency
Days on market measures how long homes take to sell from the time they are listed until they go under contract or close, depending on the report.
Shorter days on market typically indicate strong buyer demand and competitive conditions. Longer days suggest hesitation, price resistance, or oversupply.
The most important thing to watch is the trend.
A change from 18 days to 25 days matters far more than whether the number is 22 or 24. Rising days on market indicate buyers are taking more time, asking more questions, and applying more scrutiny.
In Florida, seasonality plays a major role here, so comparing the same month year over year is often more revealing than month to month changes.
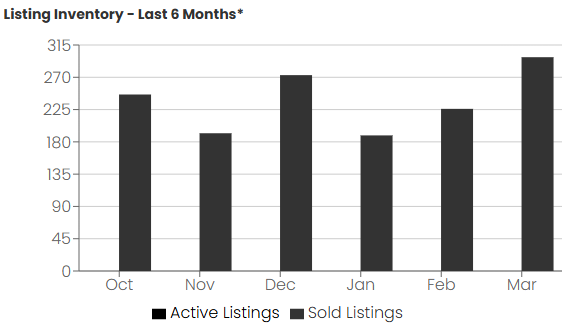
Active Listings: Measuring Available Supply
Active listings represent the number of homes currently on the market.
This metric is critical because supply is one half of the supply and demand equation.
Rising inventory generally signals that demand is softening, sellers are becoming more active, or both. Declining inventory often points to strong buyer demand outpacing new listings.
However, total inventory alone does not tell the full story. A market with 3,000 listings can behave very differently depending on how fast those homes are being absorbed.
That is why professionals quickly move from inventory counts to months of supply.
Months of Inventory: The Metric Professionals Watch Closely
Months of inventory, also called months of supply, answers a simple but powerful question.
At the current pace of sales, how long would it take to sell everything currently on the market?
This metric combines supply and demand into a single number and provides a clear sense of market balance.
As a general guideline:
Less than 4 months favors sellers
Between 4 and 6 months suggests a balanced market
More than 6 months favors buyers
Florida markets often move quickly through these ranges, especially during periods of rising or falling interest rates.
When months of inventory begins to increase, it often signals a market shift before prices reflect it.
Price Trend Charts: Direction Matters More Than the Number
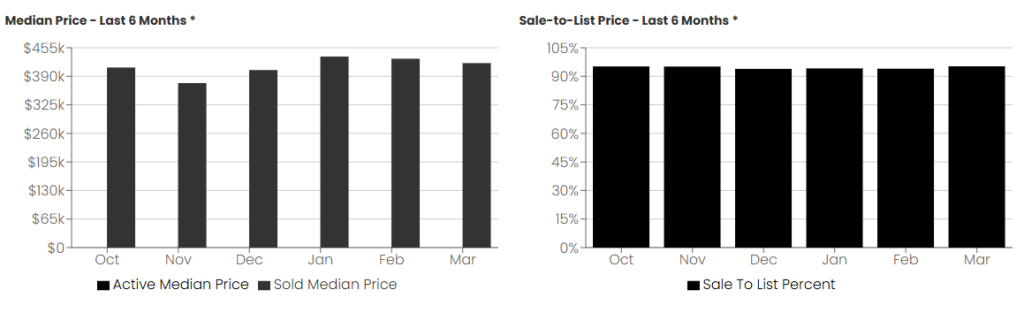
Most market reports include a chart showing sales prices over time, often by month.
These charts are not meant to predict where prices are headed next month. They are meant to show momentum.
A steadily rising trend indicates sustained demand. A flattening line suggests equilibrium. A downward trend can signal weakening demand or increasing seller competition.
Do not overreact to one unusually high or low month. Professionals look for patterns that persist across multiple reporting periods.
In volatile markets, price trends often move sideways before making larger directional changes.
Sales Volume: Understanding Demand Strength
Sales volume reflects the number of closed transactions during the reporting period.
This metric is one of the clearest indicators of demand.
If prices are stable but sales volume is dropping, buyers may be pulling back even if values have not yet adjusted. If sales volume is rising while inventory remains limited, prices often follow.
In Florida, sales volume is especially sensitive to interest rate changes, insurance costs, and seasonal migration patterns.
A sustained decline in sales volume often precedes other market adjustments.
New Listings: Seller Behavior Tells a Story
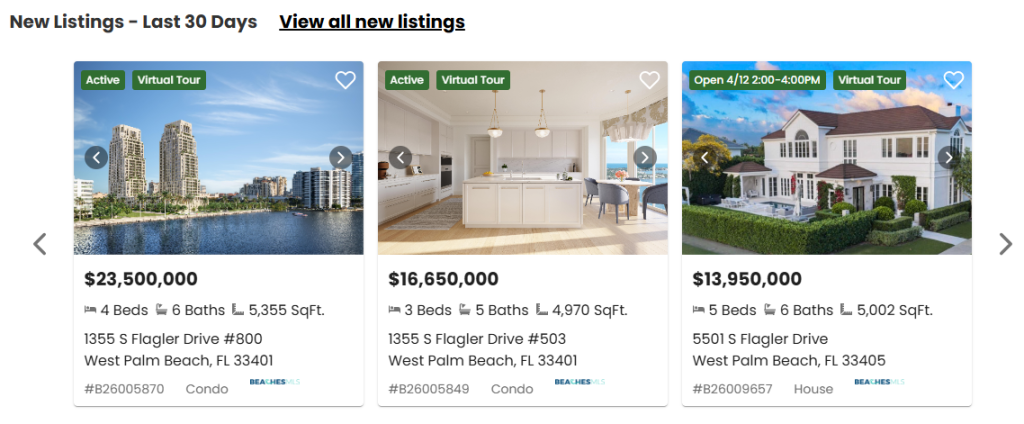
New listings show how many homes were added to the market during the reporting period.
This metric reflects seller confidence and expectations.
When new listings spike, it may indicate sellers believe conditions are favorable or fear that conditions could worsen if they wait. When new listings slow, sellers may be choosing to sit tight and delay decisions.
In many Florida markets, new listings rise sharply in spring and early summer and taper in fall and winter. Context matters.
Watch how new listings interact with sales volume. Rising listings with falling sales volume often shifts leverage toward buyers.
Pending Sales: A Forward Looking Indicator
Pending sales represent homes that are under contract but have not yet closed.
This is one of the most valuable data points in a market report because it reflects recent buyer decisions.
Pending sales often respond faster to interest rate changes and economic news than closed sales. When pending sales rise, future closings typically increase. When they fall, future activity slows.
Professionals pay close attention to pending trends, especially during periods of market transition.
List Price to Sale Price Ratio: Negotiating Power Revealed
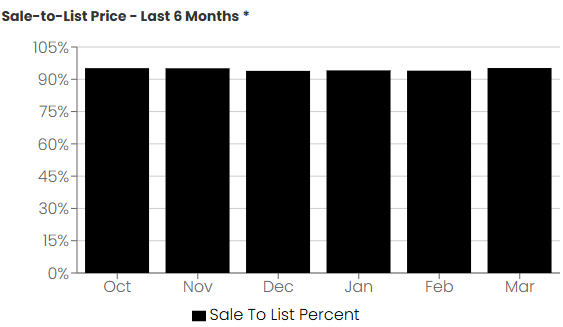
This ratio compares the original or final list price of homes to their eventual sale price.
A ratio close to or above 100 percent indicates strong seller leverage and competitive bidding. Ratios below that range suggest buyers have negotiating room.
Watching how this ratio changes over time reveals shifts in market psychology.
When sellers consistently accept less than asking price, pricing strategy becomes critical.
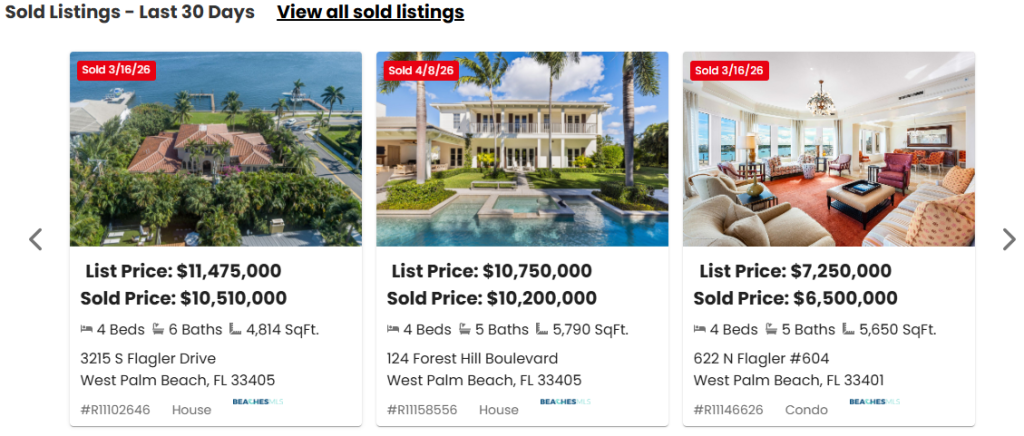
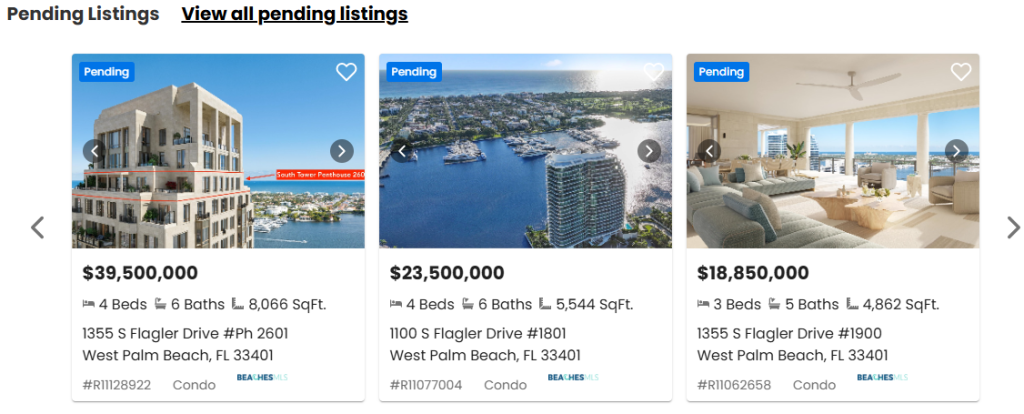
Active Listings in Context: Why the Listing Gallery Matters
Many market reports include a visual section showing active, new, and pending listings.
These are not just marketing features. They provide context.
Seeing real homes with real prices helps ground abstract data. It allows buyers and sellers to understand what inventory actually looks like and how pricing aligns with recent sales.
A market with rising inventory but strong listing quality behaves differently than a market where listings linger and price reductions become common.
Seasonality and Florida Real Estate
Florida markets do not move in straight lines.
Snowbird activity, school calendars, hurricane season, and migration cycles all influence buyer and seller behavior.
This is why year over year comparisons are often more meaningful than month to month changes.
A slower August does not necessarily signal a weakening market. A slower August than last August might.
Always account for seasonal patterns when interpreting data.
Why Local Market Reports Matter More Than Statewide Data
Florida is not one market. It is many markets moving at different speeds.
Urban cores, suburban areas, coastal cities, and inland communities all respond differently to economic conditions.
Statewide averages smooth out these differences and often hide important local dynamics.
City specific market reports provide clarity that broad reports cannot.
Common Market Report Mistakes to Avoid
Interpreting a single metric in isolation
Reacting to one month of data
Ignoring seasonality
Assuming statewide trends apply locally
Using price alone to judge market strength
Market reports reward patience and context.
How Buyers Should Use Market Reports
Buyers benefit from understanding inventory trends, days on market, and sale to list price ratios.
Rising inventory and softening demand often improve negotiating leverage. Declining inventory and faster sales signal competition.
Market reports help buyers time decisions and avoid emotional overreactions.
How Sellers Should Use Market Reports
Sellers should focus on pricing trends, months of inventory, and new listing activity.
Market reports help sellers price realistically and align expectations with current conditions.
Overpricing in a shifting market leads to longer selling times and weaker outcomes.
Final Thoughts
A Florida real estate market report is not something to skim.
It is a story told through data.
When you read each section in context and understand how the pieces fit together, market reports become one of the most powerful decision making tools available to buyers and sellers.
The goal is not to predict the future.
The goal is to understand the present clearly.
That clarity leads to better decisions.
Video Overview: How to Read a Real Estate Market Report
This video walks through a real Florida market report and explains how to interpret the charts, metrics, and trends discussed above. If you prefer a visual explanation or want to see how these data points come together in practice, this overview provides a clear, practical walkthrough.
FAQs About Real Estate Market Reports
Yes. All market reports are available at no cost.
Yes. Each report is tailored to the local market and reflects city-specific pricing, inventory, and demand.
Absolutely. These reports are designed for buyers, sellers, investors, and homeowners tracking market conditions.
Yes. You can opt in to receive a monthly market report delivered by email on the 1st of every month. These updates provide a snapshot of how the local market is changing over time, making it easier to spot trends and plan next steps.
Yes. You can sign up to receive market reports by email for the city or area you care about most. Subscribers receive clear, easy-to-read updates designed to help buyers, sellers, and homeowners stay informed without having to track the market daily.
Our market reports are reviewed and updated regularly to reflect current housing data and trends.
Property data within Easy Realty market reports is updated every 5 minutes. This ensures pricing trends, inventory levels, and market activity reflect the most current information available.
Monthly market updates are ideal for buyers researching neighborhoods, sellers monitoring timing, investors tracking trends, and homeowners who want to understand how their local market is performing without constant monitoring.